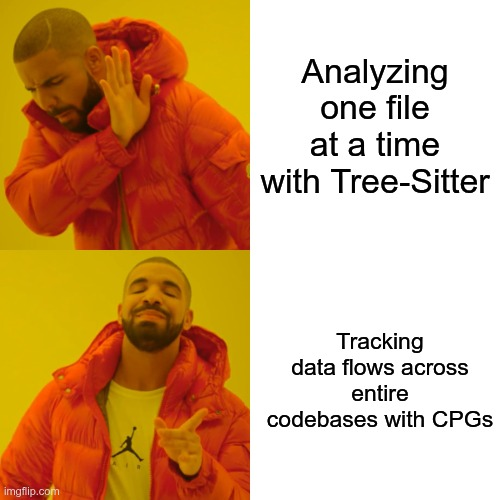
When I first started developing tools for source code auditing, my primary need was to track tainted data flows through complex codebases during manual code reviews. Initially, I turned to Tree-Sitter, which proved excellent for single-file analysis with its fast, incremental parsing capabilities. However, as I scaled to larger codebases with complex cross-file dependencies and data flows, Tree-Sitter’s AST-only approach became limiting. The challenge wasn’t just parsing individual files. It was understanding how data flows between functions, across modules, and through various execution paths during thorough manual security assessments.
Picture this: me, a noob, thinking Tree-Sitter would solve all my code auditing dreams. “It’s fast! It’s incremental! It parses everything!” I said, while happily analyzing single files like it was 1999.
My “simple” task of tracking user input through a web application turned into a nightmare of manually jumping between files, losing track of function calls, and crying into my coffee. The context-switching was brutal. I’d have an AST viewer open on one monitor, a text editor on another, and a sprawling spreadsheet trying to map out function calls and variable transformations. It was slow, error-prone, and soul-crushing. This fragmented approach is where bugs hide, in the seams between different views of the code. Traditional tools provide isolated maps—a syntax map, a control flow map—but what was desperately needed was a fully integrated GPS that understood the roads, the traffic, and the terrain all at once. Tree-Sitter, for all its beauty, only gave me the syntax tree. It was like having a map of every tree in a forest but no idea how to navigate between them.
After weeks of frustration and approximately 47 failed attempts to build my own cross-file analysis tool (spoiler: it was terrible), I stumbled upon Code Property Graphs. The angels sang, the clouds parted, and suddenly I could track data flows across entire codebases with simple queries. This was the “aha!” moment. The fundamental challenge of code analysis isn’t just understanding individual pieces but understanding their relationships.
CPGs promised the holy grail of code analysis: syntax, control flow, and data dependencies all in one queryable structure. No more juggling three different tools and a spreadsheet to track my findings during manual reviews. This report is the culmination of that journey. We will deconstruct the old ways (AST, CFG, PDG) to understand their fatal flaws, witness their rebirth in the unified CPG, learn to wield this new power with the Joern REPL, and finally, place it in the context of the wider security ecosystem.
The three musketeers: AST, CFG, and PDG
Before we dive into the CPG magic, let’s meet the three amigos that make it all possible. Think of them as the ingredients in your favorite security analysis cocktail. Understanding their individual strengths and, more importantly, their collective weaknesses is the key to appreciating why CPGs are such a monumental leap forward.
Abstract Syntax Tree (AST): The Code’s Static Blueprint (And Its Blind Spots)
The Abstract Syntax Tree (AST) is like the grammar nazi of programming. It breaks down your code into a tree structure, capturing every parenthesis, every semicolon’s intention (even if the semicolon itself gets thrown away). Generated by a parser, it represents the code’s syntactic structure according to the language grammar. It’s great at telling you WHAT your code says, but clueless about HOW it runs.
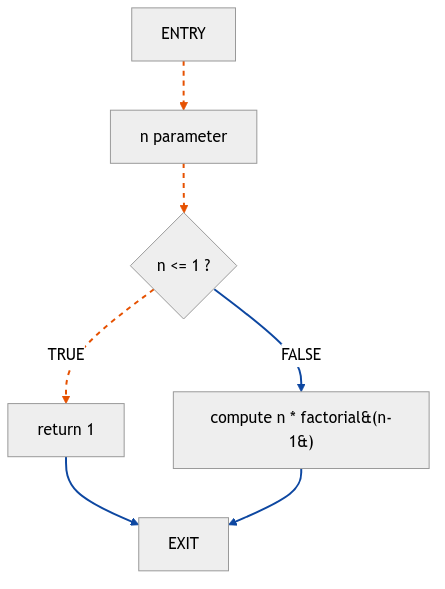
Consider this adorable factorial function:
int factorial(int n) {
    if (n <= 1) {
        return 1;
    } else {
        return n * factorial(n - 1);
    }
}
The AST sees it like this:
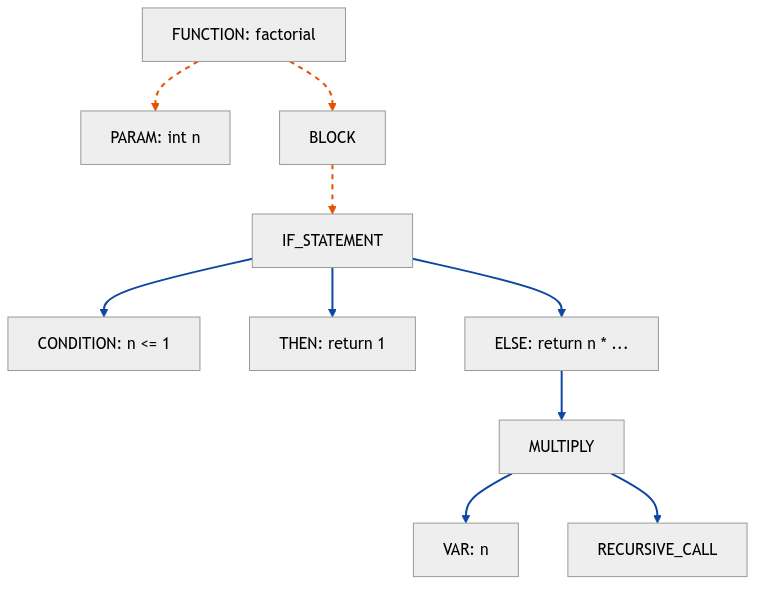
The AST is wonderful for finding patterns like “all functions that start with ‘unsafe_’” but useless for answering “can user input reach this SQL query?” That’s like asking a dictionary to plan your road trip. This is the critical blind spot of the AST: it sees structure, not flow.
To illustrate, consider a slightly more complex data transformation:
void process_request(char* user_input) {
    char temp_buffer[256];
    char final_buffer[256];

    // Some intermediate processing
    transform_data(user_input, temp_buffer);

    // Copy to final destination
    strcpy(final_buffer, temp_buffer); // Vulnerable line
}
An AST-based tool can easily find the strcpy call. It can tell you its arguments are final_buffer and temp_buffer. What it fundamentally cannot do is tell you that the data in temp_buffer originated from user_input. This gap between potential and actuality is the primary source of the high false positive rates that plague traditional Static Application Security Testing (SAST) tools. An AST represents every possible syntactic construct, but it doesn’t represent a single execution path. It shows the potential for data to be used in a certain way, but it cannot confirm the actuality of a dangerous data flow. This makes it a necessary first step, providing the “what,” but a dangerously incomplete one for security analysis because it lacks the “how” and “from where”.
Control Flow Graph (CFG): The Code’s Execution Roadmap (But Where’s the Cargo?)
The Control Flow Graph (CFG) is the GPS of your code. It’s constructed from basic blocks (sequences of code with no jumps in or out) and conditional branches. It shows all possible paths execution can take, including that weird edge case you forgot about at 3 AM. The CFG doesn’t care about your pretty syntax; it just wants to know what happens next.
Here’s our factorial function through CFG eyes:
But wait, there’s more! Let’s look at a function with a loop, because who doesn’t love a good infinite loop possibility:
void process_array(int* arr, int size) {
    int i = 0;
    while (i < size) {
        if (arr[i] > 0) {
            printf("Positive: %d\n", arr[i]);
        }
        i++;
    }
}
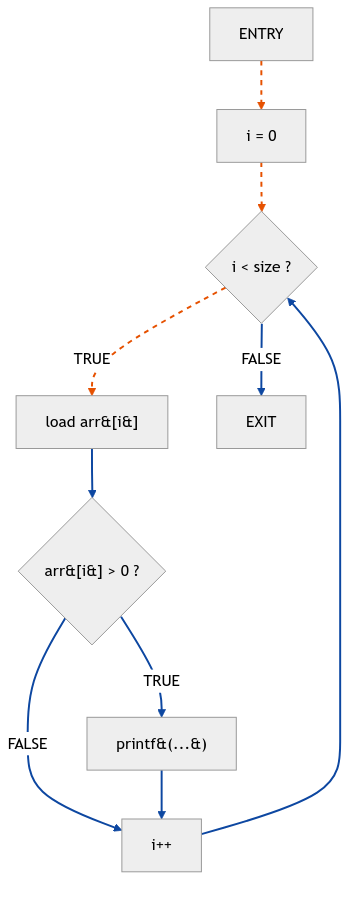
The CFG for this function clearly shows the loop structure, with an edge branching back from the end of the while block to the condition check.
The CFG adds the crucial dimension of execution order, but it suffers from a fatal flaw: it’s path-sensitive but data-agnostic. It can answer “Can this line be reached?” but not “Can this line be reached with tainted data?”.
Consider this scenario:
void handle_data(char* data) {
    char sanitized_data[256];
    if (is_safe(data)) {
        sanitize(data, sanitized_data);
    } else {
        // Path where data is NOT sanitized
        strcpy(sanitized_data, data);
    }
    execute_query(sanitized_data); // Sink
}
The CFG will show two paths converging on execute_query. It has no mechanism to differentiate the state of sanitized_data arriving at the sink. It knows the roads, but it’s blind to the cargo. This limitation is highlighted by research into Control-Flow Integrity (CFI), which demonstrates that even strictly enforcing a valid CFG doesn’t prevent all exploits. An attacker doesn’t just manipulate the path; they manipulate the payload (the data). The CFG is like a bouncer who checks that you’re on the guest list but doesn’t check the contents of your backpack.
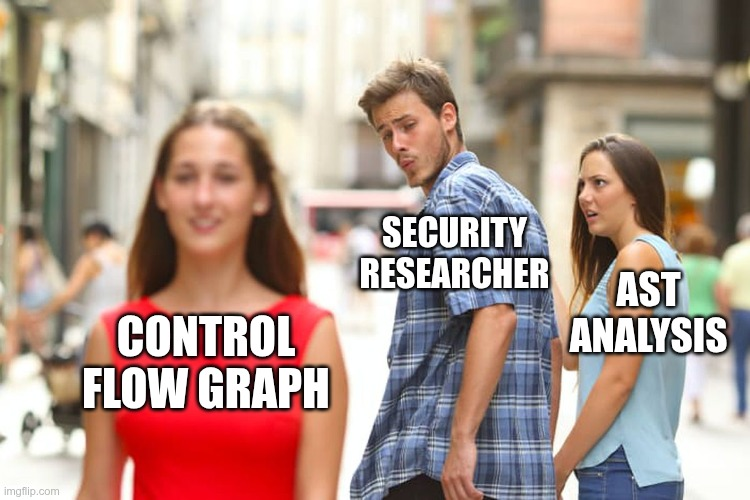
Program Dependence Graph (PDG): The Web of Influence (And Its Precision Problem)
The Program Dependence Graph (PDG) is where things get spicy. It tracks both control dependencies (what decides if code runs) and data dependencies (what values flow where). It’s like having X-ray vision for your code.
Control Dependence: A statement S2 is control-dependent on a predicate S1 if the outcome of S1 determines whether S2 executes. Data Dependence: A statement S2 is data-dependent on S1 if S1 defines a variable that S2 uses.
Here’s a potentially vulnerable function to illustrate:
int vulnerable_function(char* user_input) {
    char buffer[100];
    int length = strlen(user_input);
    if (length < 100) {
        strcpy(buffer, user_input);  // What could go wrong? 🙈
        return process(buffer);
    }
    return -1;
}
The PDG for this function would show:
- A control dependence edge from the if (length < 100) predicate to the strcpy call.
- A data dependence edge from the user_input parameter to the strlen call.
- A data dependence edge from the strlen call to the length variable.
- A data dependence edge from the user_input parameter to the strcpy call.
- A data dependence edge from the strcpy call to the buffer variable.
- A data dependence edge from buffer to the process call.
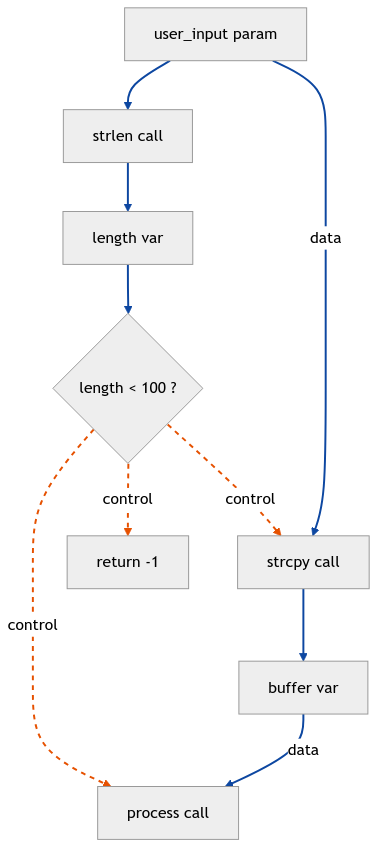
See that strcpy? That’s a classic buffer overflow waiting to happen. The PDG shows us exactly how tainted data flows from input to doom. Conceptually, the PDG is the closest of the three to what a security analyst needs, as it models influence.
However, its practical utility is often crippled by the “garbage in, garbage out” principle of dependency. The quality of a PDG is entirely hostage to the precision of the underlying analyses used to construct it. In languages like C/C++ with complex pointer arithmetic, or in modern systems like smart contracts with dynamic calls, building an accurate PDG requires a precise points-to analysis. If this analysis is imprecise—for example, it thinks a pointer could point to A, B, or C when it can only ever point to A—it will generate a web of spurious data dependence edges. This pollutes the graph with false positives and makes tracing the true flow of data nearly impossible.
| Representation | What It Models | Key Strengths | Fatal Flaw for Security Analysis |
|---|---|---|---|
| AST | Syntactic Structure | Fast, great for linting and simple pattern matching. | Blind to control and data flow. Cannot confirm if a vulnerability is reachable. |
| CFG | Execution Order | Shows all possible execution paths, models loops and branches. | Path-sensitive but data-agnostic. Cannot track the state of data along paths. |
| PDG | Data & Control Influence | Explicitly connects computationally related code, making influence visible. | Quality is hostage to the precision of underlying analyses (e.g., pointer analysis), leading to noise. |
What is a code property graph?
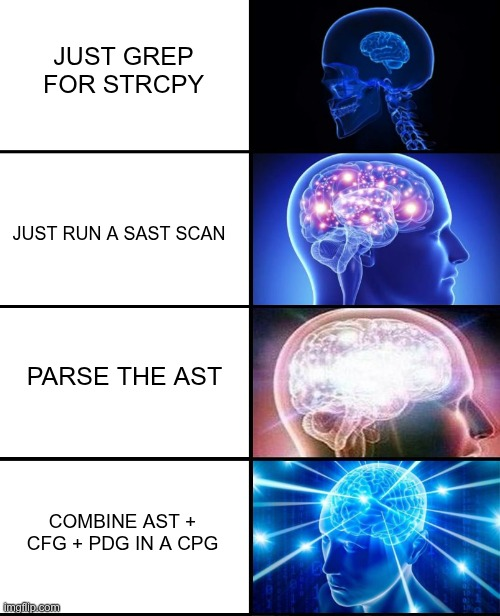
Now for the main event. A Code Property Graph (CPG) is what happens when AST, CFG, and PDG have a beautiful baby together. It’s a single graph that contains ALL the information, queryable with a unified language. No more switching between tools like a caffeinated squirrel.
Technically, a CPG is a directed, edge-labeled, attributed multigraph. Let’s break that down:
- Directed: Edges have a direction (e.g., from a caller to a callee).
- Edge-labeled: Each edge has a type (e.g., AST, CFG, REACHING_DEF) that defines the relationship it represents.
- Attributed (Property Graph): Both nodes (representing code constructs like CALL or METHOD) and edges can have key-value pairs (properties) attached to them. This flexibility is crucial, allowing us to store rich information like CODE, LINE_NUMBER, NAME, etc., directly on the graph elements.
The grand unification of the CPG is not a simple “mashing together” of the three base graphs. It’s a more elegant superimposition. The nodes of the graph primarily represent the statements and expressions from the AST. The different graph types are then layered on top as different sets of edges connecting these same nodes. A single if statement is one node, but it has:
- AST edges connecting it to its condition and body.
- CFG edges connecting it to the statements before it and the branching paths after it.
- CDG (Control Dependence Graph) edges connecting it to the statements whose execution it controls.
- REACHING_DEF edges connecting it to definitions of variables used within its condition.
This layered approach is the technical solution to the fragmentation problem. It creates a single source of truth where an analyst can seamlessly pivot between different views of the code in a single query.
Think of traditional analysis approaches like using different apps for maps, weather, and traffic. CPG is like having Google Maps with everything integrated. You can ask questions like “Show me all paths from user input to SQL queries that don’t pass through a validation function” and actually get an answer.
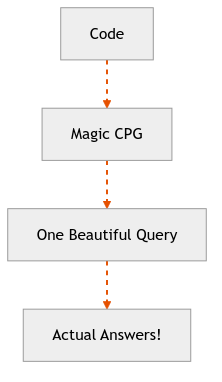
The Old Way:
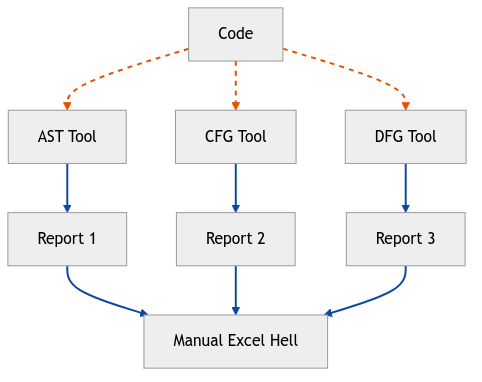
The CPG Way:
The CPG is a Swiss Army knife for code analysis that actually fits in your pocket.
Building and using CPGs
Creating a CPG is like making a good soup - you need the right ingredients, proper preparation, and patience. The construction process is a multi-layered pipeline that progressively enriches a basic representation of the code with deeper semantic information.
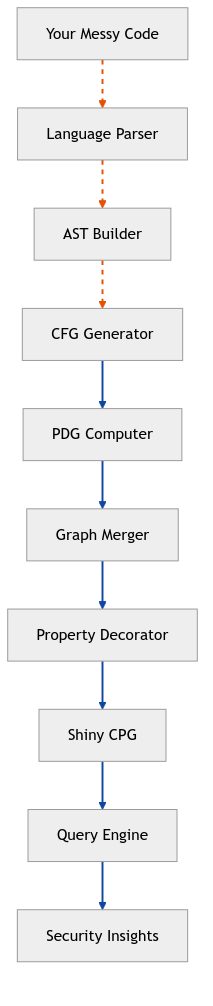
The construction pipeline, as implemented by tools like Joern, looks like this:
Parsing (Frontend): The process starts with a language-specific frontend. A key advantage of many CPG tools is the use of “forgiving” parsers, which can generate a usable AST even from code that doesn’t fully compile due to missing dependencies or minor syntax errors. This is a massive practical benefit over tools that demand a perfectly buildable project. Each language needs its own parser:
- C/C++ uses Clang (when it’s not segfaulting).
- Java uses Soot or JavaParser (yes, Soot is really its name).
- JavaScript uses the TypeScript compiler (even for regular JS, because irony).
- Python uses its built-in AST module (Python being reasonable, as usual).
AST Layer Construction: The frontend produces the foundational Abstract Syntax Tree, which serves as the skeleton of the CPG. All statements, expressions, and declarations become nodes connected by AST edges.
CFG Layer Construction: The pipeline then walks the AST and adds CFG edges between nodes, connecting them in the order of execution. This layer models control flow like if-else branches, loops, and function calls.
Dominator Tree Calculation: To determine control dependencies, the CFG is analyzed to produce post-dominator trees. A node A post-dominates node B if every path from B to the exit of the function goes through A.
PDG Layer Construction: With dominator trees and data-flow analysis, the PDG layer is added. This involves drawing CDG edges (for control dependence) and REACHING_DEF edges (for data dependence), which explicitly track the flow of values between variable definitions and their uses.
Call Graph and Shortcuts: Finally, higher-level convenience edges are added. CALL edges connect call sites to the methods they invoke, creating an inter-procedural call graph. Shortcut edges like CONTAINS are also added to link a node directly to the method that contains it, simplifying many common queries.
The magic happens in this merge phase. The CPG builder looks at each statement and says “You get an AST node! And you get a CFG edge! Everyone gets connected!” It’s like Oprah for code analysis. The result is not a merge of three equal graphs, but rather an AST that has been progressively augmented with control flow, data flow, and other semantic relationships, all within a single, queryable structure.
Once built, you can query your CPG like it’s Google for your codebase. Want to find all the places user input can reach a system() call? Just ask:
cpg.method.parameter
 .reachableBy(cpg.call.name("system"))
It’s almost too easy. Almost like cheating. But it’s not cheating if it finds real vulnerabilities, right?
Security analysis with CPGs
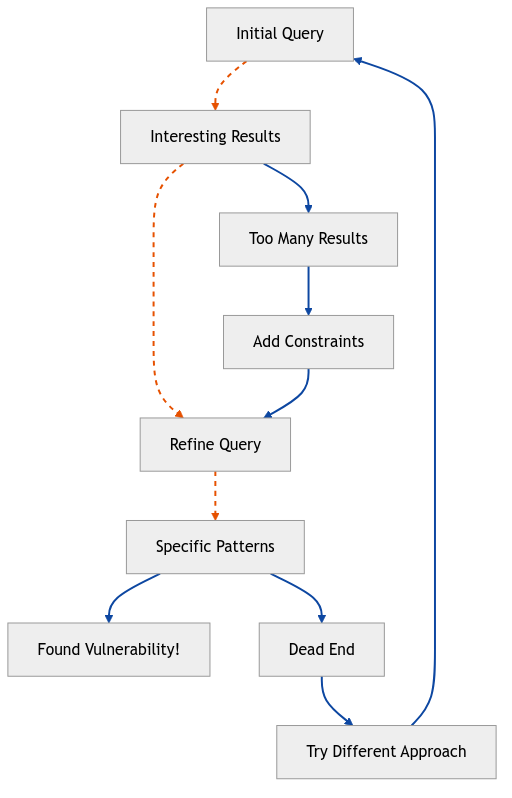
This is where CPGs truly shine. Remember spending hours manually tracing through code to see if user input could reach that sketchy SQL query? CPGs turn that into a 30-second query. The interactive, exploratory workflow mirrors a manual auditor’s thought process: start broad, identify interesting patterns, then zoom in to confirm findings.
Taint Analysis Deep Dive
The bread and butter of CPG-based security analysis is taint tracking. The core idea is to identify sources of untrusted data and track their flow to sensitive sinks.
Sources: Points where external, potentially malicious data enters the program. In a CPG, this is often represented by method parameters, especially in functions that handle web requests or user input.
def source = cpg.method.parameter.name(".*userInput.*|.*requestBody.*")
Sinks: Dangerous functions or operations that, if reached by tainted data, could lead to a vulnerability. Examples include database query functions, command execution functions, or memory copy functions.
def sink = cpg.call.name("strcpy|system|executeQuery")
The Query: The reachableBy step is the workhorse for taint analysis, finding all data-flow paths from a set of sources to a set of sinks.
sink.reachableBy(source)
Finding SQL Injection Candidates
Let’s find all database query calls whose arguments can be influenced by a method parameter that looks like user input.
// Define sources as parameters of methods that might handle user data
def sources = cpg.method.parameter.where(_.method.name(".*User.*|.*Request.*"))

// Define sinks as the arguments to common query execution functions
def sinks = cpg.call.name(".*[Qq]uery.*|.*[Ee]xec.*").argument

// Find flows from sources to sinks
sinks.reachableBy(sources).l
Buffer Overflow Detection
A classic strcpy vulnerability occurs when data from a source buffer flows into a destination buffer without a size check. We can find candidates by looking for flows from a larger buffer (or user input) to the second argument of strcpy.
// strcpy: The function that refuses to die
def sources = cpg.method.parameter.name("user_input")
def sinks = cpg.call.name("strcpy").argument(1) // Second argument of strcpy is the source

sinks.reachableBy(sources).p //.p pretty-prints the paths
Authentication Bypass Hunting
Logic flaws are about violating intended workflows. Here, we can look for “bad paths” or “missing checks.” For example, let’s find administrative functions that can be called without passing through an authentication check. This query leverages the CPG’s understanding of the call graph.
// Find admin functions with a suspicious lack of auth checks
cpg.method.name(".*[Aa]dmin.*")
 .whereNot(
    _.caller.call.name(".*[Aa]uth.*")
  ).name.l
This query finds all methods with “Admin” in their name that are not called by a method that also contains a call to an “Auth” function. This is a heuristic, but it’s a powerful way to quickly identify suspicious code paths that warrant manual review.
Advanced Pattern: Second-Order Injection
Second-order vulnerabilities, where tainted data is stored (e.g., in a database) and later used unsafely, are notoriously difficult for traditional SAST to find. CPGs can model this by chaining two data-flow queries together.
Flow 1: Source to Storage. Find paths from user input to a database write function.
Flow 2: Storage to Sink. Find paths from a database read function to a dangerous sink like a query execution.
// Step 1: Identify where tainted data might be stored
def sources = cpg.method.parameter
def storageSinks = cpg.call.name(".*save.*|.*persist.*|.*insert.*").argument
def taintedStorageLocations = storageSinks.reachableBy(sources)

// Step 2: Identify where stored data is read and used unsafely
def storageSources = cpg.call.name(".*load.*|.*find.*|.*select.*")
def executionSinks = cpg.call.name(".*query.*").argument

// Find flows from storage reads to dangerous sinks
// This is a conceptual query; a real implementation would correlate the storage locations
executionSinks.reachableBy(storageSources).l
While a CPG doesn’t model the database state itself, it models the code’s interaction points with that state. By defining database writes as intermediate sinks and reads as intermediate sources, an analyst can model this state transition through the code, a significant leap beyond stateless pattern matching.
The beauty is in the interactivity. Start broad (“show me all user inputs”), find interesting patterns, then zoom in like a CSI investigator, except your enhance button actually works. During manual reviews, I use CPGs to:
- Map the entire attack surface (15 minutes vs 5 hours).
- Trace all user inputs to sensitive operations.
- Verify security controls are actually called (spoiler: they often aren’t).
- Find that one weird code path everyone forgot about.
Why CPGs beat traditional tools
Let me count the ways CPGs make traditional static analysis look like stone tablets:
Single Source of Truth: No more correlating reports from 17 different tools. One graph to rule them all. The CPG integrates syntax, control flow, and data flow, eliminating the context-switching and manual correlation that plague fragmented analysis approaches.
Language Agnostic Querying: Whether you’re reviewing Java, Python, or that cursed PHP legacy code, the query concepts remain the same. While the frontends are language-specific, the resulting CPG structure and the query language are universal. It’s like having a universal translator for vulnerabilities.
Interactive Exploration: This is the killer feature for manual auditors. Traditional SAST is a “fire and forget” black box that produces a static report. CPG analysis is a conversation. You start with a hypothesis (“I bet user input reaches this function”), formulate it as a query, and get an immediate answer. You can then refine your query iteratively, digging deeper into the code’s structure. This workflow transforms analysis from a passive review into an active investigation.
Path Sensitivity (with a caveat): While a single CPG data-flow query is not strictly path-sensitive in the way symbolic execution is, the combined graph allows for path-sensitive reasoning. You can combine CFG traversals with data-flow queries to ask questions like, “Show me data flows from A to B, but only along paths that also pass through C.” This allows an analyst to filter out irrelevant paths and focus on those that meet specific control-flow criteria.
Joern: your CPG companion
Joern is the Swiss Army knife of CPG tools - if Swiss Army knives were free, open-source, and could find buffer overflows. It is the original implementation of the Code Property Graph concept and has been the foundation for a vast amount of academic and industry research in vulnerability discovery.
Getting started is easier than explaining why you need another security tool to management:
# Download and install the latest version
wget https://github.com/joernio/joern/releases/latest/download/joern-install.sh
chmod +x joern-install.sh
./joern-install.sh

# Congrats, you're now a CPG wizard

# Parse your victim... I mean, target codebase
# This generates the CPG and saves it as cpg.bin
joern-parse /path/to/code

# Enter the matrix (the interactive shell)
joern
Once inside Joern’s REPL, you are interacting with a Scala shell that has your CPG pre-loaded into the cpg variable. You can start asking questions like a security-obsessed detective:
// "Show me all your vulnerabilities!"
// Find all calls to functions with 'unsafe' in their name
cpg.call.name(".*unsafe.*").l

// "Where does user input go to die?"
// Find data flows from parameters named 'input' to command execution sinks
def source = cpg.method.parameter.name(".*[Ii]nput.*")
def sink = cpg.call.name("exec.*|system")
sink.reachableBy(source).p

// "Find me all the SQL construction shenanigans"
// A simple heuristic for string-concatenated SQL queries
cpg.call.code(".*\\+.*sql.*\\+.*").l
The best part? Joern speaks multiple languages, thanks to its modular frontend architecture :
- C/C++ (including all the undefined behavior)
- Java / JVM Bytecode (verbose but supported)
- JavaScript/TypeScript (callback hell included)
- Python (even the duck-typed madness)
- Go (goroutines and all)
- LLVM Bitcode and x86 binaries (via Ghidra)
“Pro” tips for using Joern:
- Start simple: Don’t write War and Peace as your first query. Begin with cpg.method.name.l or cpg.call.name.l to get a feel for the codebase.
- Use .l to list: The .l (short for .toList) terminator executes the traversal and prints the results. Without it, you’re just building a query object in memory.
- Export findings: Use run.toJson or custom scripts to save your results before you accidentally close the REPL.
- Steal liberally: The Joern community maintains a query database with pre-built queries for common vulnerabilities. Use them as a starting point.
Joern integrates beautifully with manual review workflows. Export your findings to JSON, generate graph visualizations with .dotAst or .dotCfg to impress management, or just use it to win arguments about whether that code path is actually reachable (spoiler: it usually is).
Glossary
- AST (Abstract Syntax Tree): Your code’s family tree, showing who inherits from whom, but not who talks to whom at runtime.
- Basic Block: A chunk of code that executes together without any jumps in or out, like a clique that always hangs out.
- CFG (Control Flow Graph): A map of all possible execution paths, including the ones that lead to doom.
- CPG (Code Property Graph): The ultimate code analysis multigraph that makes other tools jealous.
- CPGQL: The query language for CPGs - like SQL but for finding bugs instead of customer data.
- Data Dependence: When one piece of code needs data from another, like a coffee addiction but for variables.
- Control Dependence: When code execution depends on a condition, like your mood depending on coffee availability.
- Edge: A connection in the graph, not the U2 guitarist.
- Frontend: The parser that reads your code and judges your variable naming choices.
- Node: A point in the graph representing code elements, not a JavaScript runtime (confusingly).
- PDG (Program Dependence Graph): Shows both control and data dependencies, like a relationship status diagram for your code.
- Property: Extra information attached to nodes, like metadata but actually useful.
- Reaching Definition: When a variable assignment successfully travels through code to reach its use, represented by a REACHING_DEF edge.
- Sink: Where potentially dangerous data ends up, like system() calls or SQL queries - the code equivalent of a black hole.
- Source: Where external data enters your program, usually carrying gifts of XSS and SQL injection.
- Taint Analysis: Tracking dirty data through your clean code, like following muddy footprints on a white carpet.
- Traversal: Walking through the graph, like exploring a dungeon but with more null pointers and fewer dragons.
References and further reading
Want to dive deeper into the CPG rabbit hole? Here are the resources that helped me on my journey from Tree-Sitter frustration to CPG enlightenment:
Essential reading
Wikipedia: Code Property Graph - Start here for the academic foundation and formal definitions.
The Original CPG Paper (2014) - Yamaguchi et al.’s groundbreaking work that started it all. This paper received the IEEE Test-of-Time Award in 2024 for its lasting impact.
CPG Specification - The formal specification of the CPG structure, layers, nodes, and edges, as implemented by Joern.
Joern documentation and tutorials
Official Joern Documentation - Comprehensive guide to CPG concepts and Joern usage.
CPG Query Language Tutorial - Interactive tutorial for learning CPGQL with real-world vulnerability examples.
Joern Blog - Regular updates on new features, advanced techniques, and vulnerability case studies.
Video tutorials
- Introduction to Code Property Graphs - Visual explanation of CPG concepts. - Hands-on demonstrations of vulnerability hunting with Joern.
Alternative implementations
- CPG Github - An alternative CPG implementation with a strong focus on multi-language support and formal specifications.
Community resources
- CPG Query Examples - A community-contributed database of vulnerability detection queries for Joern.
Remember: the best way to learn CPGs is to start querying.