
Quick note: this post is less technical than usual. I just felt like telling, openly, the story of the tool I’m working on, and mostly how I felt all along the way.
The realization: three years of SAST
It’s been more than three years now that I’ve been doing DevSecOps. In this job I use a fair amount of SAST, and overall I find them a bit lame. They surface the most obvious vulns, sure, but the moment things get a little twisted, it’s really not great.
Coming out of school I wanted to do pentest (super original, I know), so I was also running a lot of boxes on HTB. That stuck in the back of my head.
My first real job: code auditing
My first gig was at a consulting firm (an ESN), doing “DevSecOps as a service”. Basically, clients came to us for two things: integrating DevSecOps tools (SAST, SCA, DAST) into their CI/CD, and sometimes code audits.
When the team onboarded me on the audits, they walked me through the methodology and the tools. The flow was always the same: run a SAST, triage its results, then move on to manual analysis.
For the manual part, we wandered through the code in VSCode. The goal: identify sources and sinks, and check that a source never reaches a sink without the data being cleaned up along the way. The good old taint tracking.
The tooling: VSCode and two extensions that save your life
I won’t insult you by explaining what VSCode is. But over the course of my audits, I started looking for extensions to improve quality of life during review.
First find: weAudit by Trail of Bits (their blog post is worth the read). The idea is simple and brilliant: take your notes and track your findings right inside the editor, instead of juggling a Google Doc on the side. You highlight a region of code to mark it as a finding (with title, severity, description, exploit scenario), you check files off as audited to track progress, and you share all of it with your co-auditors through a single file in the project’s .vscode. No cloud, no server: a file that travels with the repo.
Then, Inline Bookmarks by tintinweb. Here the idea is to drop colored bookmarks via comment tags right in the code: @audit, @audit-info, @audit-ok, @audit-issue… Each tag gets a color, shows up in the gutter, and all the bookmarks land in a tree view on the side. Since they’re just comments, they stay in the file and travel with the rest. Perfect for marking your sources and sinks without losing track.
The frustration: why do pentesters get the nice toys?
When I started code auditing, I was doing a lot of reading and training on web pentest on the side. And pentest has a ton of super cool, really polished tools: Burp Suite, Caido, BloodHound, nuclei, and so on.
Using sharp tools for pentest and, next to that, doing code audits in VSCode (which is cool, but clearly not built for big apps), it eventually built up real frustration. Why do pentesters get the nice toys and we don’t?

A quick detour through SAST (because we have to)
So far I haven’t said much about SAST, and that’s on purpose. Personally, I find them pretty cool and very useful early in the software lifecycle. A SAST, as a reminder, is static analysis: it reads your code without running it and looks for vuln patterns.
The problem is that code audits usually happen late in the SDLC. And at that point, even with a nice interface, the SAST results are pretty weak. Not to mention the staggering number of false positives depending on the project. A false positive is the tool crying wolf on code that’s actually fine: you waste a ton of time triaging for nothing.
And yet, SAST rely on genuinely neat tech. Digging a bit, I came across custom rules.
Custom rules: Semgrep, CodeQL, Joern
Semgrep
Semgrep lets you write your own detection rules in YAML, then rescan with them. And honestly, writing rules is simple and really well documented, which is far from being the case everywhere.
You’ve got several ways to match: pattern to target an expression, and above all a taint mode with pattern-sources, pattern-sinks and pattern-sanitizers to follow data flow and raise a finding when a source reaches a sink without being sanitized.
It’s cool, but you have to write a rule, rescan, check, tweak, rescan again… and find the right balance between true and false positives. The more generic your rule, the more false positives you generate and the more time you spend triaging. Logical, but painful.
CodeQL
Digging further, you run into CodeQL, built by GitHub. CodeQL lets you “talk” to your code as if you were running SQL queries against a database: it turns the code into a queryable database and you write queries in QL to follow flows and taint, including across functions.
When I discovered this, I had stars in my eyes. It’s exactly the kind of tool I was looking for. Except the license is restrictive: it’s free on open source code and for academic research, but the moment you use it on private or proprietary code (typically a client’s code on an engagement), you need a GitHub Advanced Security license. The queries themselves are MIT-licensed; it’s the CLI engine that carries GitHub’s proprietary terms, and “open source” there strictly means an OSI-approved license: a client’s code never qualifies. For an auditor doing consulting, that’s a dealbreaker.
Joern
Then I came across Joern. Open source, under the Apache 2.0 license, so free even for commercial use. It also turns code into a queryable graph (a Code Property Graph, more on that soon), and you query it through a Scala-based query language in an interactive shell. The CPG concept comes from a 2014 IEEE S&P paper by Fabian Yamaguchi and co-authors, who used it to dig up 18 unknown vulns in the Linux kernel. Yamaguchi is also Joern’s original author: the tool is pretty much the paper’s reference implementation.
The comparison with CodeQL fits in one sentence: CodeQL is more polished and more precise, but locked down by its license for commercial use; Joern is free, but rougher.
And “rougher” is the right word. Joern’s problem is a fairly steep learning curve, and above all, as far as I know, no way to save your findings with the code next to them. You find something, and you sort out how to note it down somewhere else.
That’s when I told myself: “what if I built my own tool?”
“What if I built my own?”
At first, I wanted to build my own SAST, one that would finally give me real results. That’s when I understood it was an absolute nightmare.
The idea I had was to get the equivalent of BloodHound, but for code auditing. BloodHound, for those who don’t know it, models Active Directory relationships as a graph and lets you find attack paths (the famous shortest path to Domain Admin) with queries. But a vuln, deep down, is also a path: source to propagation to sink. The exact same graph traversal problem.
So: represent a codebase as a graph, and run custom rules or presets to check whether there’s a vuln. Basically, a Joern with a nice UI/UX.
So don’t ask me why, but at first I wanted to code my own CPG algorithm. I went with tree-sitter as the base layer, which gave me a very clean AST. The upside of tree-sitter is good language coverage out of the box and a mature tool.
An AST (Abstract Syntax Tree) is your code’s syntactic structure: the grammar, nothing more. A CPG (Code Property Graph) is an AST PLUS the control-flow graph PLUS the data-dependence graph, all merged into a single graph. It’s that merge that makes taint queries possible. And between an AST and a CPG, there’s a world: you have to build control flow, data flow, the call graph… a huge amount of engineering, specific to each language. If you want to dig deeper, I wrote a whole post about CPGs.
I quickly started getting completely unreadable results, because my algorithm was bad, to be honest.

I was frustrated I couldn’t make it do what I wanted. So I stopped developing that tool for good. It was called spotted, and it was my biggest letdown. Disappointed I hadn’t pulled it off, and hadn’t even managed to ship something remotely usable.

The comeback
Over time, I kept reading up on these topics, and I came across some insane articles (or a good friend sent them my way, shoutout to Adrien). Two I really recommend:
- WTF is AI-native SAST? by Parsia. His thesis, no bullshit: AI-native SAST is just “SAST + AI”. Classic SAST has always been bad at certain bug classes (authorization, business logic) because it doesn’t grasp the code’s intent. The idea: let static analysis spot where to look, then send the LLM to target those spots with just the relevant context. AI doesn’t replace SAST, it builds on it.
- The Deductive Engine by pwno. They flip it around: instead of using the LLM as the SAST’s assistant, they make it the reasoning engine itself. The LLM reasons in taint analysis the way we’d do intuitively (backward propagation, find-definition, find-reference). Result: about three dozen vulns in a router binary in a single day, 12 of them validated with working PoCs. All self-funded, at roughly 4 dollars and 1 to 8 minutes per bug.
Reading that, seeing what people manage to pull off, got me seriously fired up again. Not to mention the friends who pushed me to pick the dev back up (shoutout to skilo, had, hexo, billy, adrien).

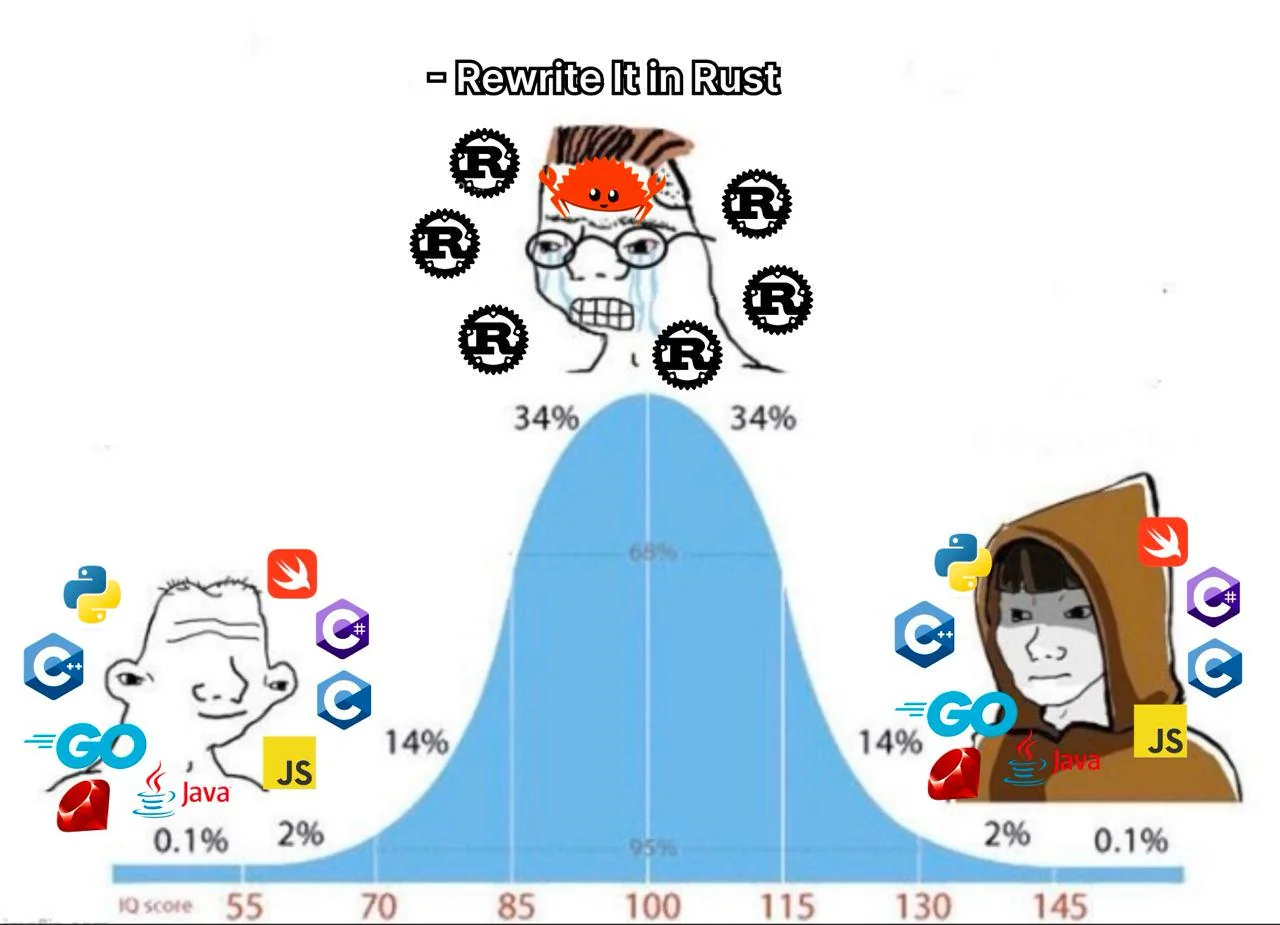
Starting over (and in Rust, don’t ask why)
I decided to start over. And this time, to build on Joern: either way, I have neither the time nor the technical skills to re-develop an engine like that.
So I focused on integrating Joern into a more modern code audit workflow. A web app that lets you ingest codebases, query them (Joern queries) and orchestrate this whole little world.
This happened to coincide with me learning Rust. So, to my own despair, I decided to do the entire backend in Rust. Help.
After two months of dev, I had a minimally viable tool for my personal use. The catch: UX-wise it wasn’t great, and UI-wise it was genuinely horrible. Since I’d leaned on Claude quite a bit, the UI looked like most vibe-coded tools. And since I do care about design, that really bugged me.

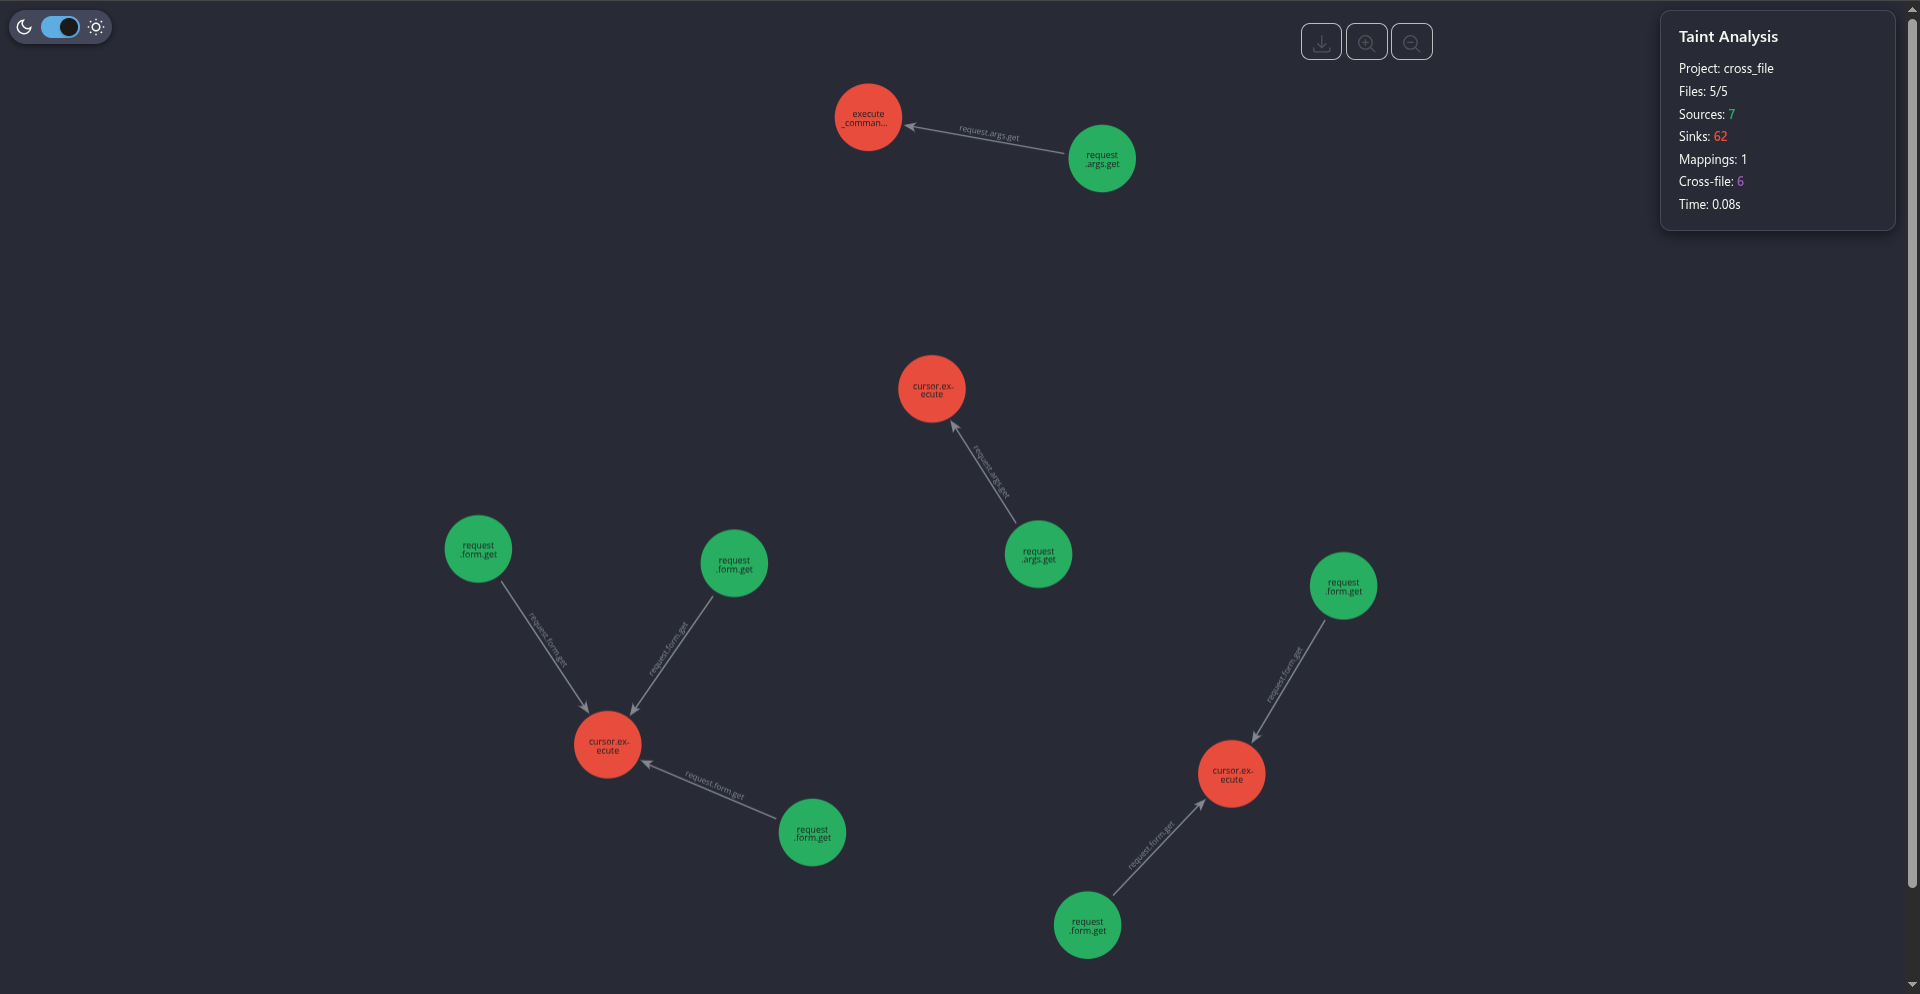
Here are a few examples of the first UI:
The first CVEs!
Time passed, and I managed to find my first CVEs with this tool. That was the moment to start showing it to my coworkers.
Honestly, I was surprised by the reception. Most of them found the tool really cool and saw its real value. That made me genuinely happy. Knowing others share my take and that what I built can be useful, I found that really nice. I’ve got a fair number of tools on my GitHub, but most are small projects that aren’t really used.

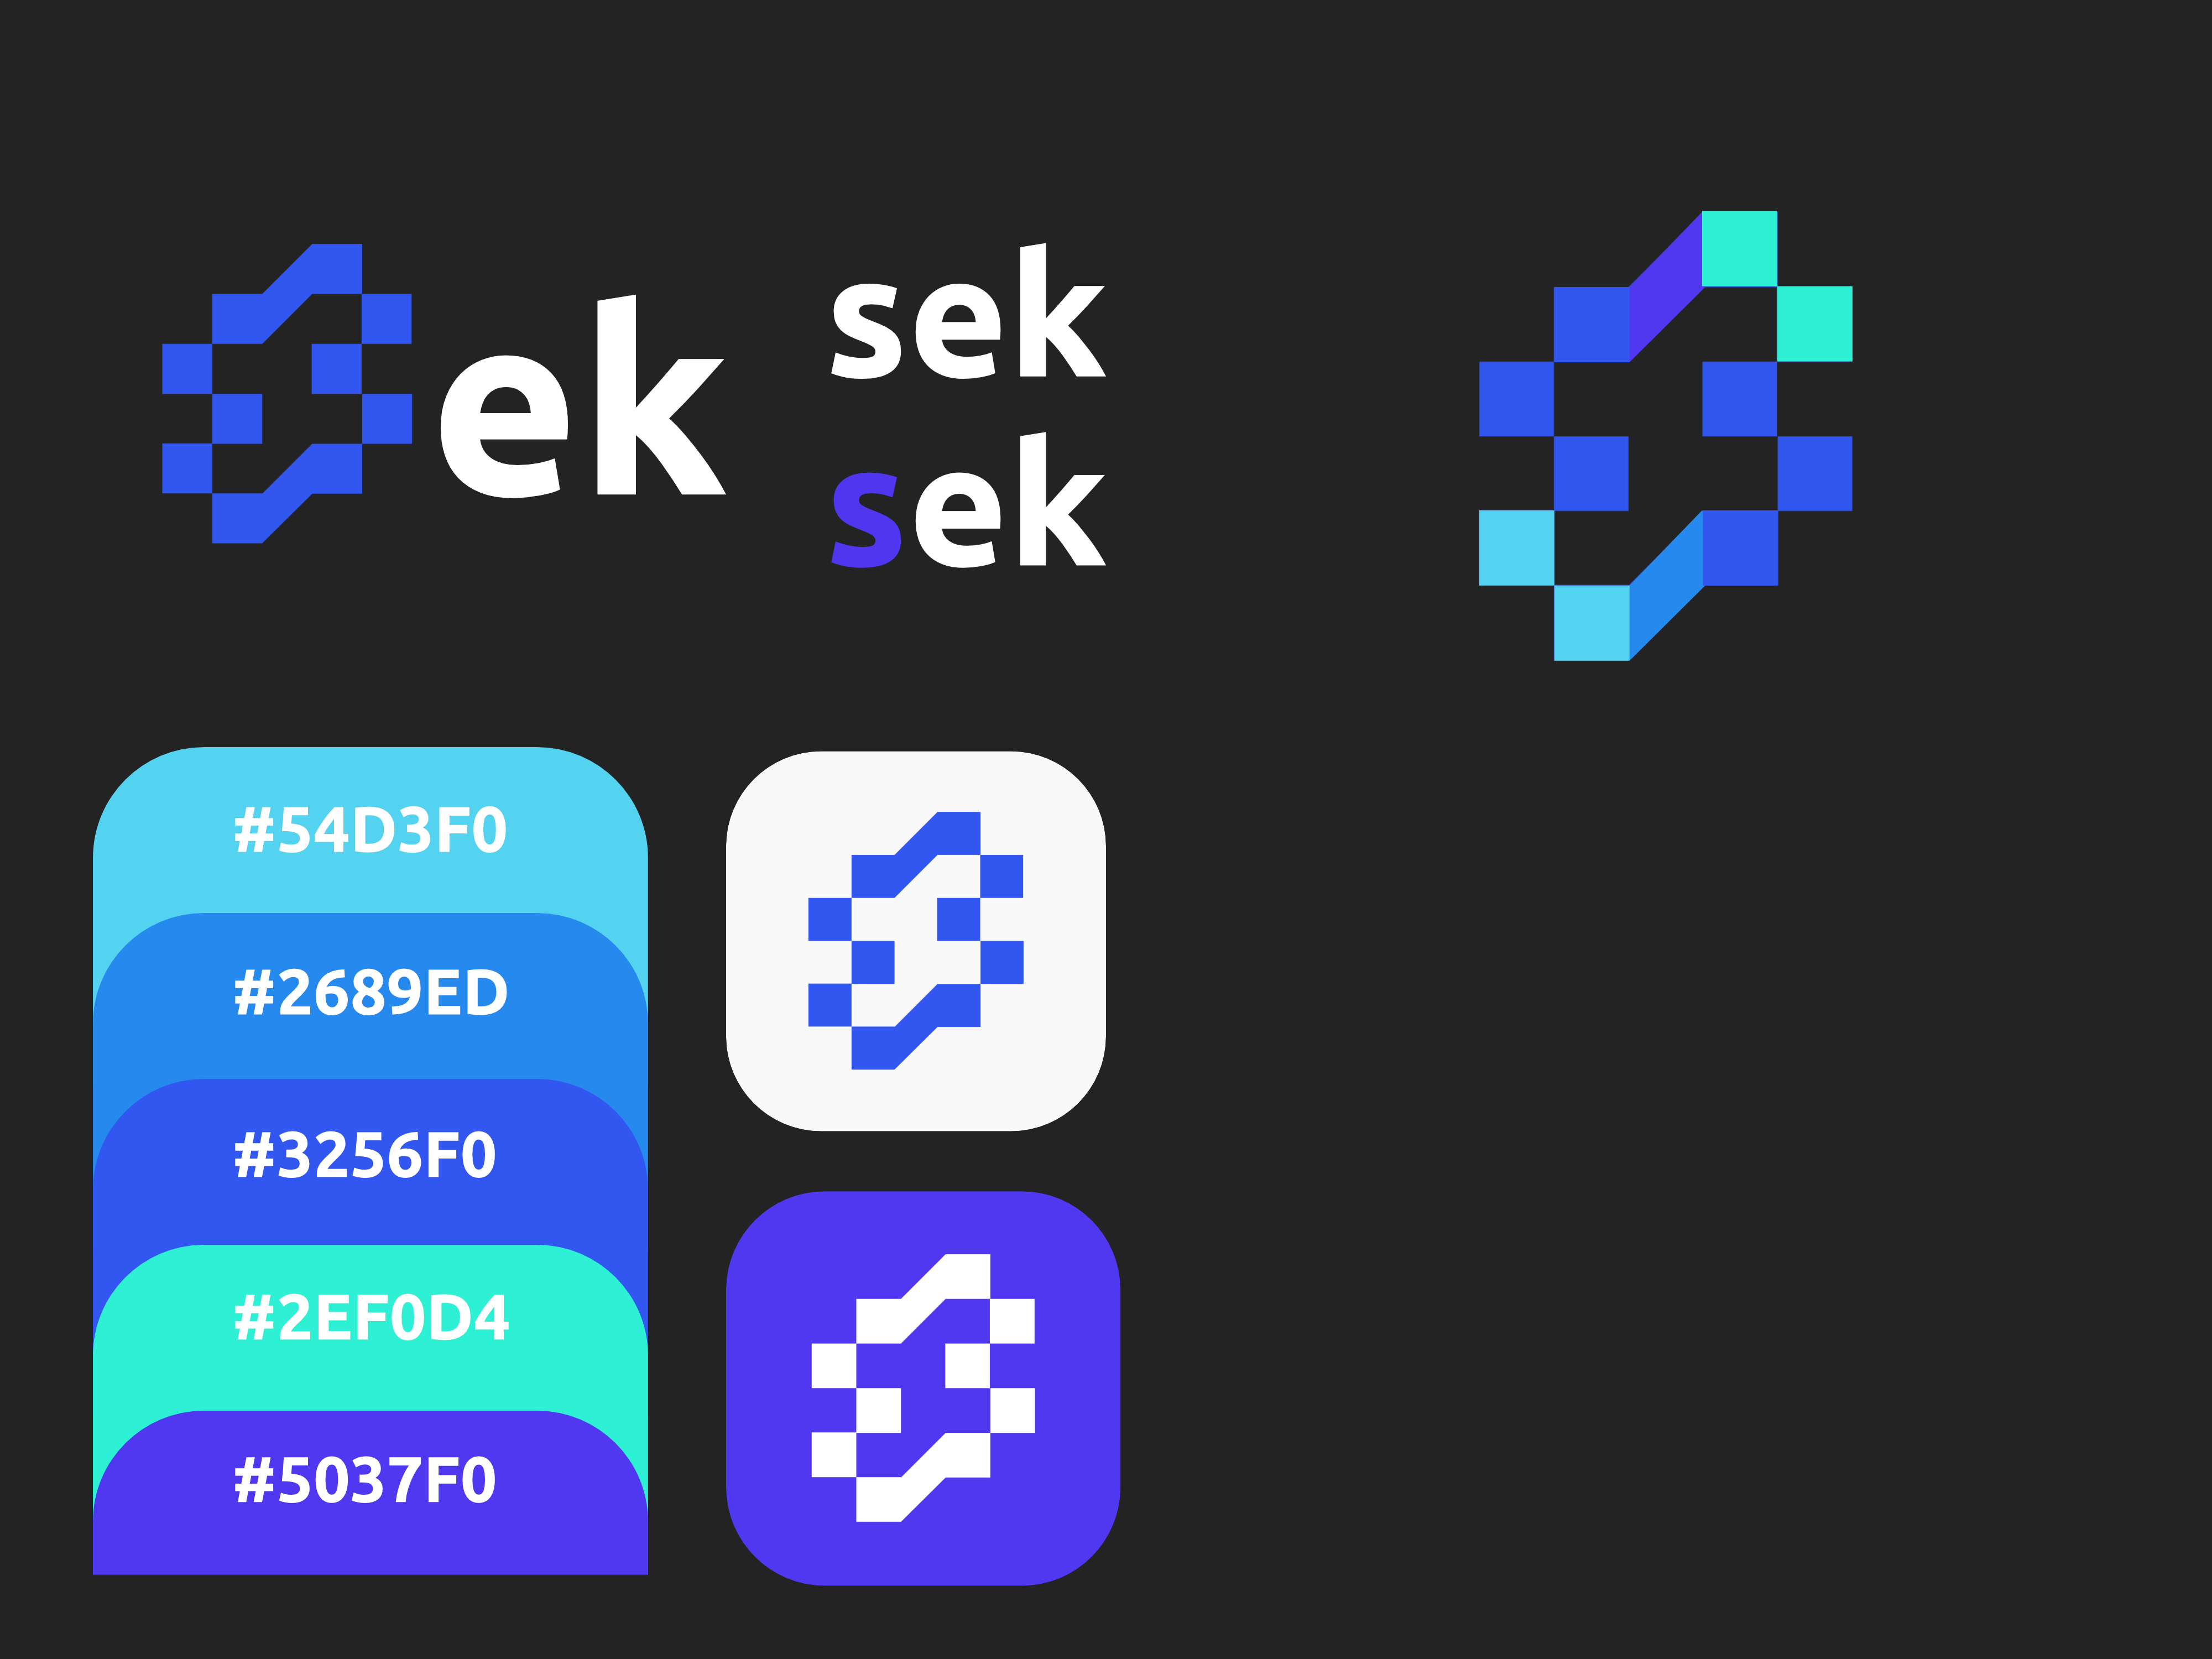
sek
After a small bug bounty break, I got back to serious dev on the tool. It has a little name, by the way: sek.
To kick things off right, I set myself a goal: define the art direction (logo, color palette, typeface). I get that some people find this tedious, but personally it’s really my favorite part, even if I’m far from being a pro at it. Here’s the charter I landed on:
Then, a full UI rework. I started with a Figma prototype to get a clearer view, and honestly it helped me a ton.
End of May: so close, so far
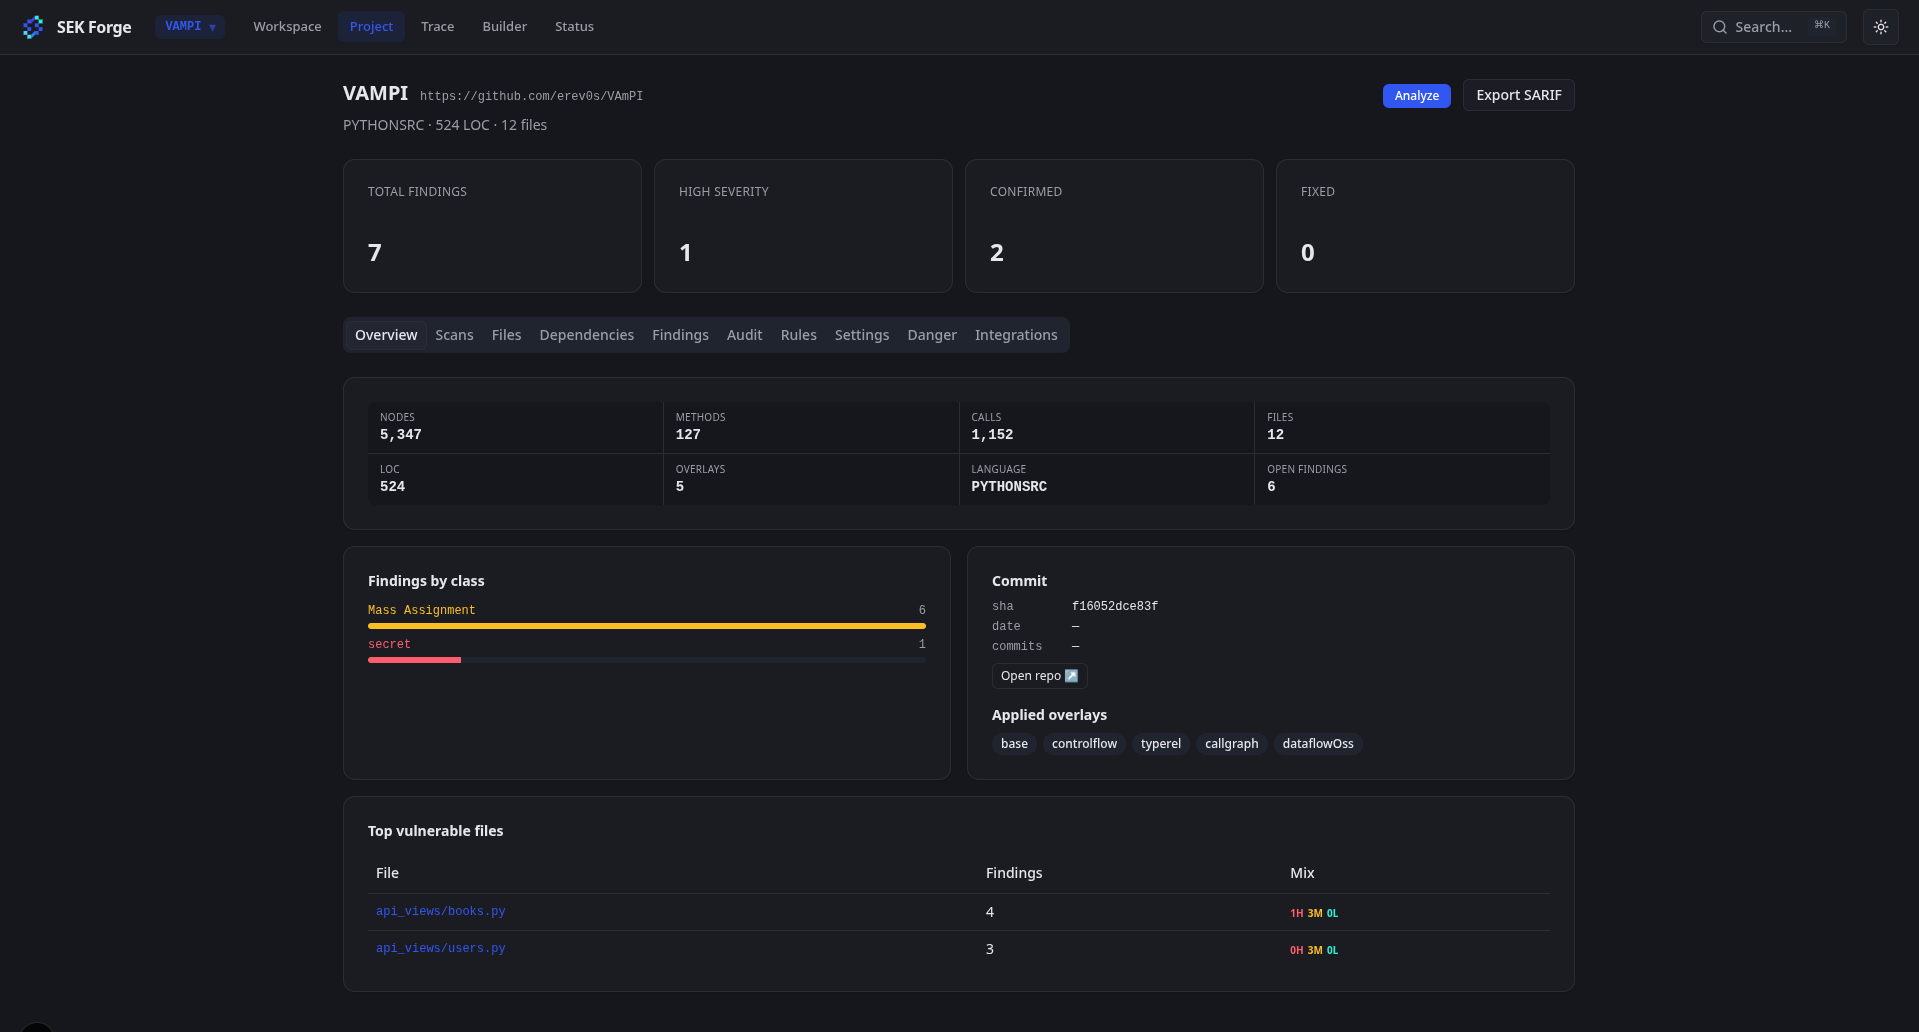
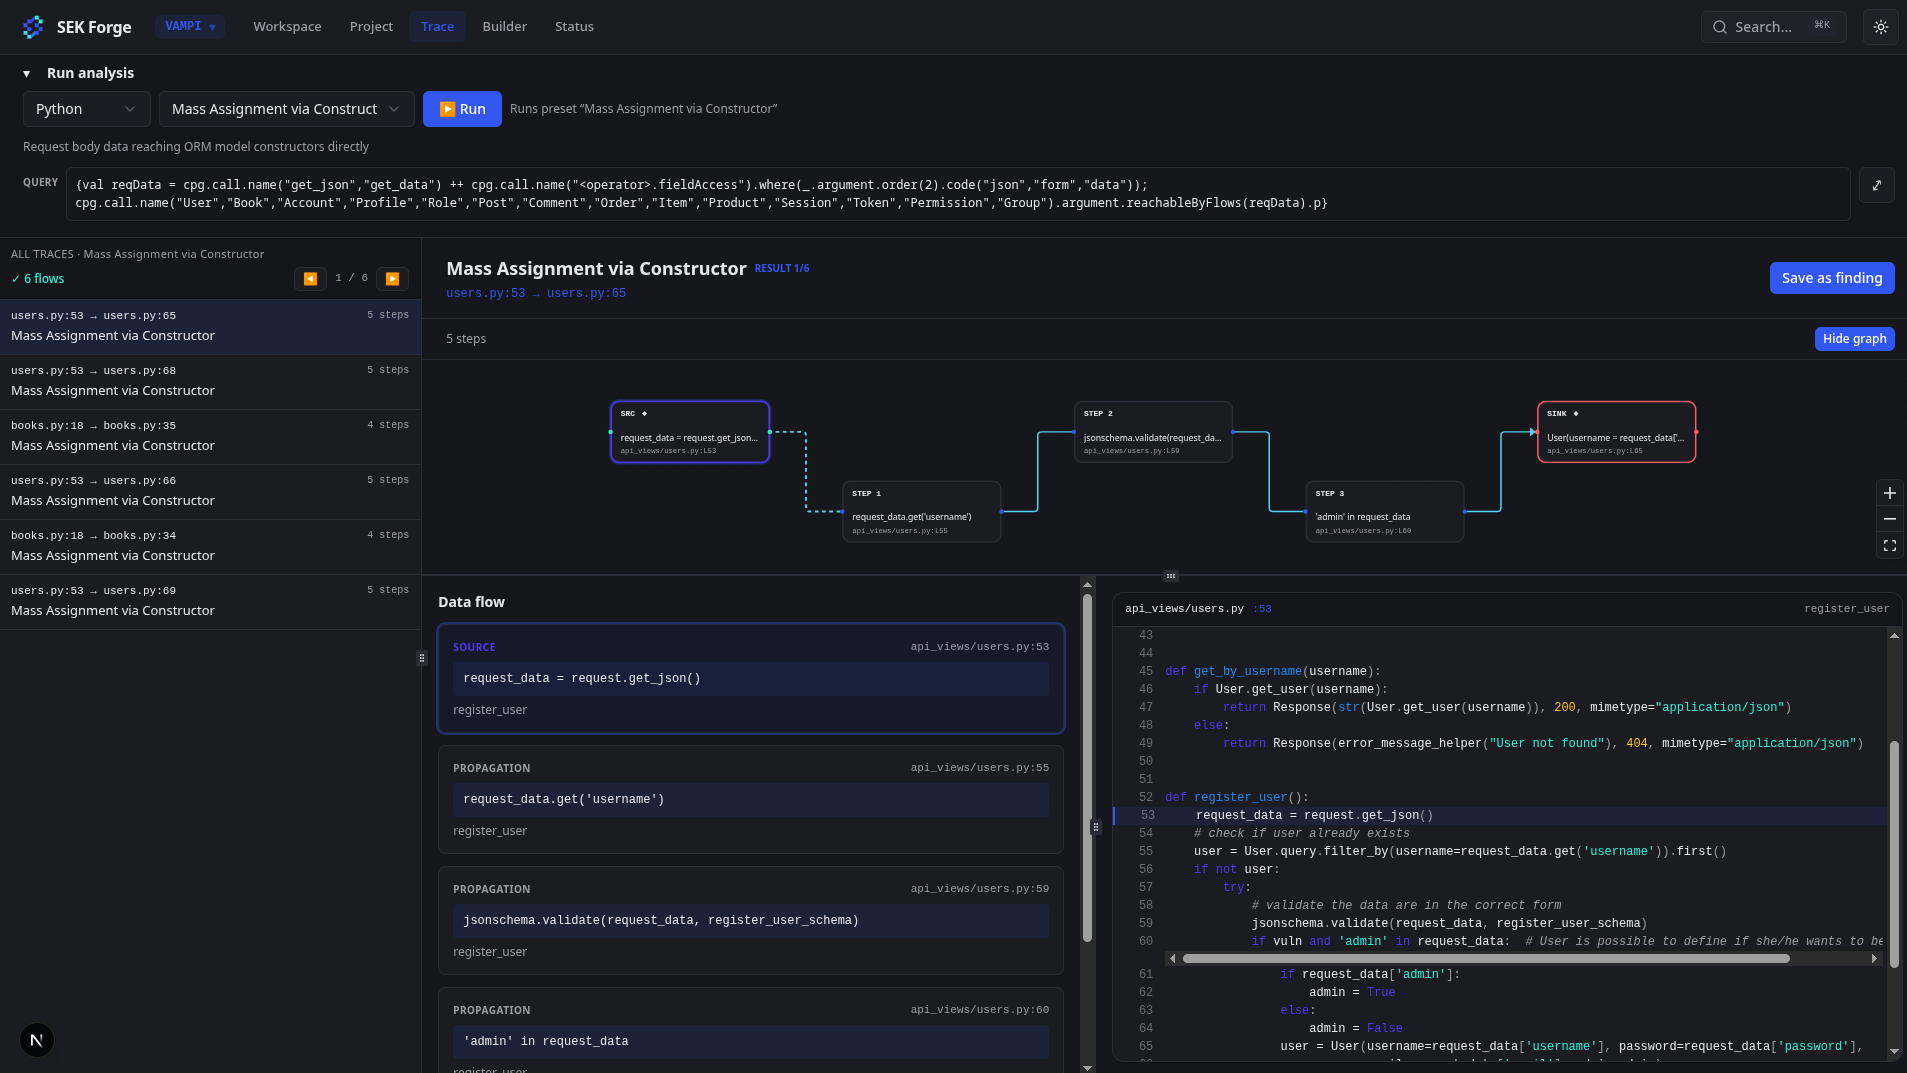
And here we are, end of May. I’m starting to have a nearly viable tool, and it feels great to be so close to the goal. But the further I get, the more I realize I’m not as close to the final version I want as I thought.

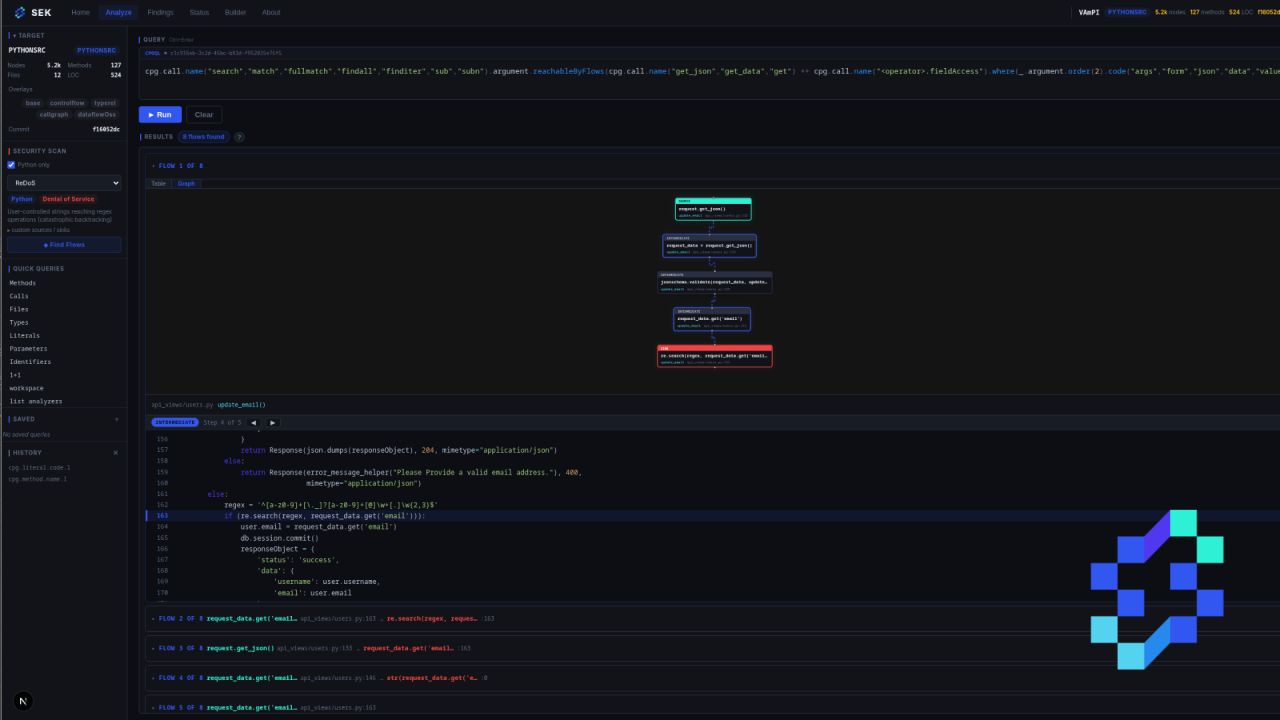
Here are a few images of the tool, without spoiling too much:
What’s next
That’s it. I hope you’ll enjoy this format too. I’ll keep writing posts about my adventures with this tool.